More and more composites blowing in the wind
Wind energy is putting the uncertainty that was the hallmark of this industry in the rearview mirror. Electricity from this renewable resource is cheaper and more competitive than it's ever been — and getting more so. This massive consumer of composite materials has a bright future.
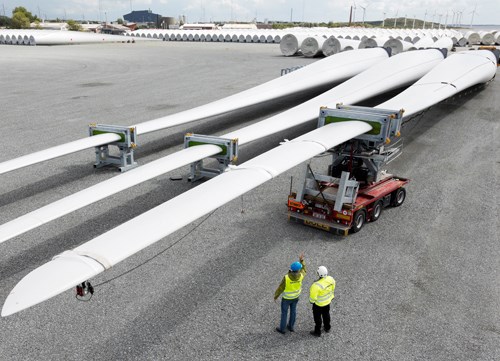
Wind blade length is increasing onshore and offshore to help wind turbines capture more wind energy.
The result is increased composites material use, but also increased demand for more efficient manufacturing and tooling systems. Wind turbine manufacturers also face the problem of the
Square-Cube Law, which says, in essence that wind blade mass increases faster than wind turbine
power as rotor diameter increases. (Source: Siemens)
There is no end market served by the composites industry that consumes more composites materials than wind energy. Aerospace, automotive, marine and other end markets are important to the composites industry, but none of them uses as much material as the wind energy market does. Wind blades are the primary consumer, using glass fiber, carbon fiber (in some blades), resin matrix, foam core, balsa core, adhesive and coating. A 47m blade for a 3-MW turbine weighs almost 30,000 lb/12,474 kg, with blade mass, naturally, increasing as turbine power capacity increases. The longest blades today — up to 80m — are deployed on offshore wind turbines. Wind blade length is expected to continue to grow as the next generation of turbines is developed.
All wind turbine blade manufacturers face one predominant problem as turbine and blade sizes increase, and it’s a simple physics problem. Called the Square-Cube Law, it comes in two parts:
- Wind turbine power is proportional to the square of rotor diameter
- Wind blade mass increases in proportion to the rotor diameter cubed.
What does this mean in practice? Basically, it’s this: Wind blade mass increases at a greater rate than wind turbine power as rotor diameter increases. So, not surprisingly, as rotor diameter increases, there is great interest among wind blade manufacturers in finding or developing composite material options that meet standard strength, stiffness and durability requirements, but at a reduced weight. And the composites industry is responding to this demand, with material suppliers introducing the last few years a myriad of fibers, resin, adhesives and core materials designed to optimize blade manufacture and efficiency.
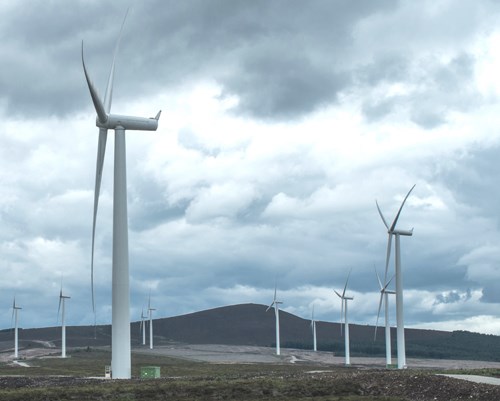
Wind farm. (Source: Siemens)
The top 10 global wind turbine manufacturers (by market share) are Vestas, Goldwind, Enercon, Siemens, Suzlon Group, General Electric, Gamesa, United Power, Ming Yang and Nordex.
As wind blade manufacturers sort out their material strategies, wind farm developers have been busy the last few years making wind the fastest growing energy source in the world. In the process, the cost of wind energy has dropped dramatically, making it cheaper than coal and second only to natural gas.
Looking at the global wind energy market, 2015 was a record year, with more than 63 GW of new wind energy installed, for a new global total of 432.9 GW. This represents a 17% increase over the 2014 total. By far and away, the country with the most new wind installed in 2015, and the most cumulative wind overall, was China. It installed 30.8 GW of wind in 2015 to reach a total installed base of 145.4 GW. A distant second in both categories was the United States, with 8.6 GW installed and 74.5 GW total. In third place is Germany (6 GW/44.9 GW).
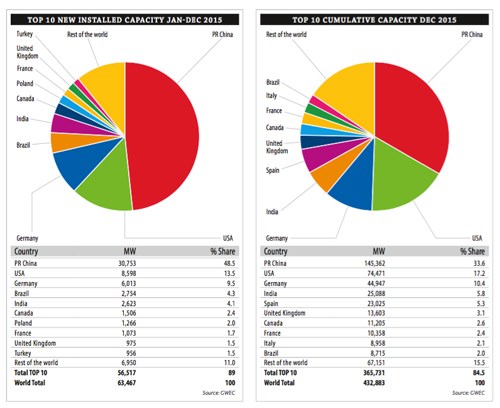
Global new installed and cumulative wind capacity, through 2015.
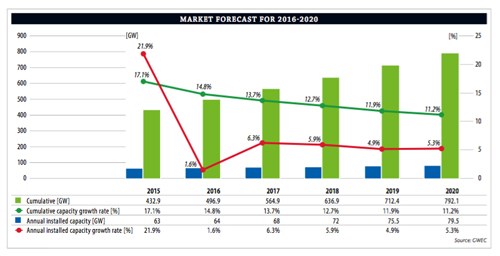
Global wind market forecast, 2016-2020.
In the United States, the five-year extension of the federal Production Tax Credit (PTC) has created unprecedented market stability that allows sustained and robust wind farm development and erection. Through the middle of 2016, there were 12.5 GW of wind power capacity under construction, with another 5.8 GW in advanced stages of development. The US state with the most wind power is, by far, Texas, with 17.9 GW installed. Second is Iowa (6.4 GW), followed by California (5.7 GW), Oklahoma (5.5 GW), Illinois (3.8 GW) and Kansas (3.8 GW). There are 10 US states that do not have wind energy capacity: Arkansas, Louisiana, Mississippi, Alabama, Georgia, Florida, South Carolina, North Carolina, Virginia, Kentucky.
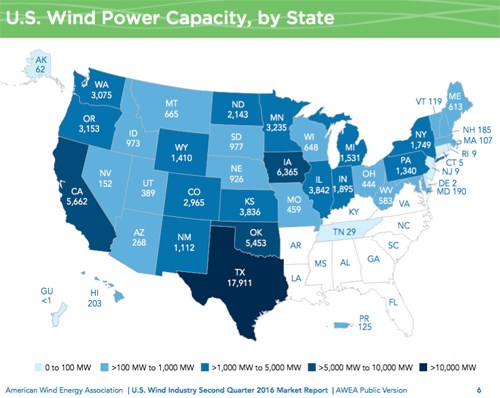
US wind power capacity, by state.
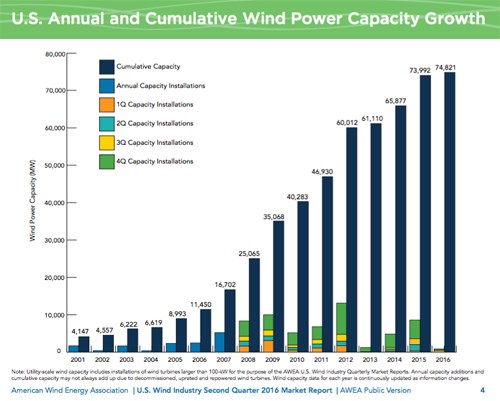
US annual and cumulative wind power capacity growth.
The US Department of Energy has established a goal for wind energy production: By 2030, 20% of US electricity should come from wind energy. As of 2015, that number was 4.7%, which puts the 20% target within reach if the current rate of installation and innovation continues. Wind the US produced more than 190 million MWh of in 2015, followed by China at 185.1 million MWh. (The American Wind Energy Association says that stronger wind resources in the US allow its smaller installed base to beat China’s larger installed base.)
The United States continues to lag behind Europe in development of offshore wind resources, primarily because European waters near in the North Sea and around England are shallow enough that wind turbine towers can be anchored directly to the sea/ocean floor. In the US, the best offshore winds are along the nation’s east coast, where deep water demands use of floating turbines in many cases.
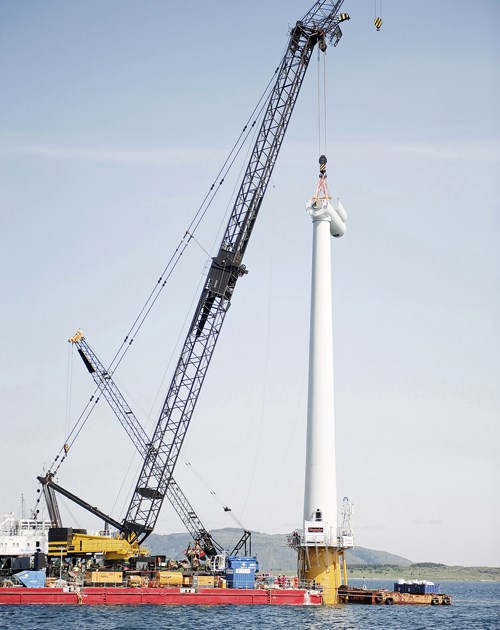
Siemens floating tower being installed. (Source: Siemens)
The UK leads all countries in offshore wind with 5.1 GW of installed capacity, followed by Germany (3.3 GW), Denmark (1.3 GW), China (1.0 GW) and Belgium (712 MW). The US, however, is making progress, with the installation of five 6-MW turbines near Block Island, just off the southern coast of Rhode Island.
Wind, globally, has clearly established itself as a significant and growing source of energy that shows no sign of abating or slowing. Policy stability in the United States, a determined effort in China to expand wind energy and a fast-growing offshore wind program in Europe are combining to consume significant composite materials for the foreseeable future. Because of this, wind energy remains one of the most important and dynamic end markets served by the composites industry.
If you're headed to CAMX and are interested in learning more about materials being developed for wind, be sure to catch the conference presentation by Owens Corning Composite Solutions Business titled, "How Glass Reinforcements Support the Cost of Electricity Reduction in the Wind Industry," Tuesday, Sept. 27 at 2:30 p.m.
Resources:
Related Content
Adhesives, material solutions promote end market versatility
CAMX 2023: Rudolph Bros. and Co. highlights its role as a prominent specialty chemical distributor and solutions provider with a display of high-performance adhesives, sealants, materials and more from well-known manufacturers.
Read MoreBiDebA project supports bio-based adhesives development for composites
Five European project partners are to engineer novel bio-based adhesives, derived from renewable resources, to facilitate composites debonding, circularity in transportation markets.
Read MoreHenkel releases digital tool for end-to-end product transparency
Quick and comprehensive carbon footprint reporting for about 58,000 of Henkel’s adhesives, sealants and functional coatings has been certified by TÜV Rheinland.
Read MoreFilm adhesive enables high-temperature bonding
CAMX 2024: Aeroadhere FAE-350-1, Park Aerospace’s curing modified epoxy, offers high toughness with elevated temperature performance when used in primary and secondary aerospace structures.
Read MoreRead Next
Developing bonded composite repair for ships, offshore units
Bureau Veritas and industry partners issue guidelines and pave the way for certification via StrengthBond Offshore project.
Read More“Structured air” TPS safeguards composite structures
Powered by an 85% air/15% pure polyimide aerogel, Blueshift’s novel material system protects structures during transient thermal events from -200°C to beyond 2400°C for rockets, battery boxes and more.
Read MoreAll-recycled, needle-punched nonwoven CFRP slashes carbon footprint of Formula 2 seat
Dallara and Tenowo collaborate to produce a race-ready Formula 2 seat using recycled carbon fiber, reducing CO2 emissions by 97.5% compared to virgin materials.
Read More


