Turning data into gold
The composites manufacturing environment is awash in data. It's possible to harvest that data and start predicting problems before they occur.
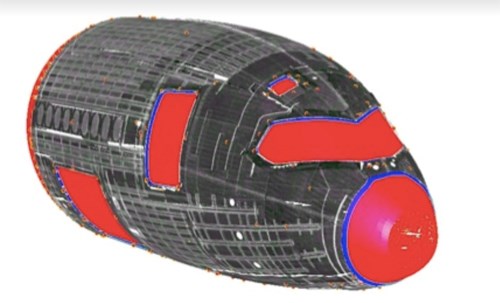
Figure 1: 3D Predictive Data Analytics (3D PDA) allows for valuable trending analysis (courtesy of NLign Analytics).
Editor’s note: Composites industry veteran Steven Rodgers, principal of EmergenTek LLC (South Jordan, Utah, USA), has been working with NLign Analytics (Cincinnati, Ohio, USA) on composites processing data collection and management strategies. Today’s CW Blog is penned by Rodgers and explores the upside of good data management. Included, here and at the end, is a survey he and NLign Analytics are conducting regarding process data collection.
Costs. Most would agree that they are the curse of the high-performance composites industry. Alas, as demand goes up, so does the price of carbon fiber composites. Worse, many companies grapple with how to remain profitable while meeting their customers’ cost targets. What do you do when, to cite a recent case, your customer demands a 15 percent cost reduction…just for you to remain on their bidder’s list?
Forget your lean and Six Sigma programs. You have already squeezed as much as you can out of those tubes. So where do you turn to cut the remaining fat? Thankfully, there maybe a way out. Consider that in the course of everyday manufacturing you already collect an enormous amount of process data. Could that data be rescued from your storage files and be put to better use?
We slavishly collect all that data — on incoming material properties, certificates of conformance, bag leak checks, cure charts, NDI scans, material out times, dimensional checks, process metrics, key characteristics, ply-by-ply orientation data — ultimately to gather dust in the files. Once we verify conformance and the part is on its way to the customer, we lock that data away in a file cabinet and save it, often for decades.
Would you be surprised to learn that when we simply archive data we may be guilty of locking away one of the most valuable diagnostic resources available to us? Much of that data embodies the potential for valuable trending analysis if we only knew what to look for and why. This is represented by an emerging discipline known as 3D Predictive Data Analytics (3D PDA).
For example, let’s say you have a part that has always passed non-destructive inspection (NDI) without rejectable porosity. Suddenly it exceeds the acceptable standard. The part is either rejected or sent to the material review board (MRB) for disposition.
Is this an anomaly, or is it the result of a trend that we have failed to identify? If this failed as the result of a worsening trend, then there is a reasonable chance that you will begin to fail more parts for the same reason. If not, perhaps you are in good shape.
But you just don’t know. You don’t know because we as an industry have never appreciated the possibility that applying 3D PDA to our NDI data might identify trending data that can spot a potential failure before it happens. In our manufacturing environment, anything that is not a failure goes on to the next operation with little concern. But if we were to analyze the NDI data pre-failure, looking for trends, we might have a huge impact on company profitability.
According to a recent McKinsey & Co. report, “In manufacturing, operations managers can use advanced analytics to take a deep dive into historical process data, identify patterns and relationships among discrete process steps and inputs, and then optimize the factors that prove to have the greatest effect on yield.”1
When you consider the cost of failure, the skilled use of 3D PDA may allow companies to recover as much as 10 percent of their gross revenues. They avoid discrepancies that are perceived as simply being “part of the process.”
Case Study: Data from the past predicts future failure
When dealing with high-performance, anisotropic materials like composites it is important to know what the laminate looks like on the inside. From “kissing disbonds” to porosity, NDI techniques are used to help us look at the continuity of a part or assembly. In the process, tremendous amounts of data are produced toward one end: To demonstrate that the part is functionally sound.
The key to the 3D PDA software’s success is its ability to quickly crunch terabytes of data, a chore that is far too big and cumbersome to be done manually using spreadsheets or other simple tools. Once the software has done the homework, it presents the results visually in a clear, concise way.
Here is an example of how Spirit AeroSystems (Wichita, Kan.) was able to use historical data to reduce scrap and rework. There is a move in the industry to produce larger, increasingly complex co-cured assemblies in order to reduce part and fastener count. As a result, the cost associated with the risk of discrepant hardware goes up exponentially. One such assembly at Spirit AeroSystems was chosen to apply 3D PDA to accumulated NDI data to see if any trending data might emerge.
All of the parts that had been scanned to date had been within acceptable limits. The company took the data from the last 15 ship sets of assemblies and overlaid the data onto the digital part model (Fig. 1). Distilling and analyzing more than 7 terabytes of data in just a few minutes, the results showed that one area of the assembly had been developing porosity in one specific location. With each ship set the porosity had been increasing, but with the sheer mass of data being collected with each scan, no one had noticed. Why? Because every part had been within the acceptable limits.
However, that was about to change. The trending data indicated that within a few more ship sets the assembly would exceed the allowable level of porosity and would become discrepant. A quick investigation revealed that a leak had been developing in one of the tools required to build the assembly; the leak was repaired before it jeopardized the hardware. Given the cost of the assembly and the accumulated costs of failure, the total savings from this one exercise was many times greater than the cost of the software.
Other companies have achieved similar savings by employing 3D PDA to avoid discrepancies, scrapped parts and the onerous costs of MRB action.
Case Study: A hole by any other name
Another kind of data in which we compile terabytes of largely unused information is dimensional data. We confirm the size, shape, hole patterns and other important elements that apply to configuration. We verify that the part falls within the acceptable criteria and then we lock the information away (again!) without considering that there may be valuable data lurking in it.
Take, for example, another complex assembly. This composite structure (Fig. 2) had already gone through layup, assembly, cure, NDI and all of the required inspections that go with those steps, so it was already a costly assembly. Then it was presented for CNC machining. This tight-tolerance operation went smoothly with no recorded discrepancies during the inspection. In a normal factory, that would have been the end of the story, but in this case the company applied 3D PDA for the first time.
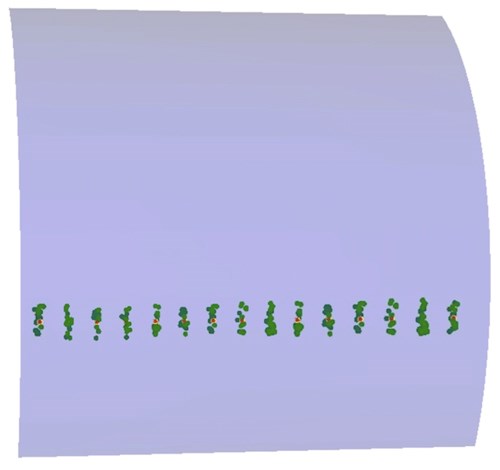
Figure 2: With 3D PDA analysis, the bearings that supported the cylinder were introducing dimensional variability into the process (courtesy of NLign Analytics).
Again, the data from numerous assemblies was collected and applied to the part model. Again, several terabytes of raw data were analyzed. Here is what they found:
The dimensions in the axial direction were well within tolerance. However, the analysis also revealed a different condition in the radial dimensions. All of the holes were within tolerance, but they were approaching an out-of-tolerance condition. More importantly, they were trending toward that condition progressively. Upon investigation, the fabricator found that the bearings that supported the cylinder were introducing dimensional variability into the process. The company replaced the bearings and the holes moved back to the nominal dimensional accuracy that had been documented at the beginning of the program. Once again, a problem had been solved before it actually became a problem.
The U.S. National Institute of Standards and Technology (NIST) has coined the phrase The Digital Thread to describe the heart and soul of what The Economist called “the Third Industrial Revolution.” This industrial revolution is one in which the thread of data from design through manufacturing is used at every step of the process to improve efficiency and reduce overhead costs. It is vital to the progress of the advanced composites industry that we continue to transition from art to science.
Using 3D PDA supports this concept in ways that are not always obvious to people in our industry. As a company begins to identify commonalities in the analyses, that data can be fed back to design engineering or manufacturing engineering in such a way that the design, planning and preparation for the manufacturing of new hardware will be streamlined, more efficient and more trouble free. In the initial instances in which this approach has been used, first-pass yields for new hardware have improved dramatically.
Suddenly an age-old problem becomes much more manageable. Until the advent of PDA the common experience was that of a beleaguered producibility engineer trying to reconcile the manufacturing capability with a part design that had been “tossed over the fence” from engineering. As always, the goal is to consistently and cost-effectively manufacture that part while improving first-pass yields and reliability.
Now 3D PDA provides a vehicle to feed the lessons learned from advanced trending analysis back to the engineering staff so that when future designs are released, many of the manufacturing challenges have already been addressed. Designs become more robust, tools become less troublesome and processes become more efficient. With improved information sharing comes improved manufacturing. Every DR, every MRB action, every scrapped part and every repair that is avoided improves overhead costs.
There is one benefit of 3D PDA that is often overlooked. We all know the importance of risk mitigation in this high value-added environment. We understand how reducing risk can benefit our manufacturing facility and overheads. But do we appreciate the impact it has on our customers?
In nearly every major request for quotation (RFQ) there is a section asking the supplier to address how they intend to mitigate risk on behalf of the customer. The elements of risk mitigation involve the risk of late deliveries, of substandard hardware, of excessive requests for MRB support, of price escalation or a dozen other factors. All of these risks are mitigated by the application of 3D PDA.
According to a Quality Engineer for a major OEM in our industry who has the job of auditing and preparing suppliers for vendor qualification, this is becoming an increasingly important consideration among the primes. With first-pass yields varying from 60 percent to as much as 98 percent, a credible risk mitigation plan can be the distinguishing factor among suppliers competing for work. When the most common tool used for data analysis is the ubiquitous spreadsheet, the use of 3D PDA software presents a powerful statement to the customer that a supplier is serious about continuous process improvement. What is interesting is that the investment in software is usually quite modest when compared to the financial benefits that the software can bring.
These are just a few upper-level examples of the many ways in which 3D PDA has been used to improve the performance of advanced composite manufacturers. As experience is being accumulated by supplier and OEM alike, there are many more applications of the software that are turning up significant opportunities to improve a company’s competitiveness by mitigating risk, reducing overheads and enhancing the bottom line.
We are interested in continuing to build the information base that will allow the industry to develop new software tools and applications. This will support the critical task of bringing the costs down for advanced composites. In order to do so, we are inviting you to participate in a brief survey that will provide information. As a thank you for giving us seven minutes of your time we will send you the results of the survey once they are compiled.
Also, to extend the discussion, we are also providing an in-depth report on how 3D PDA might impact MRB.
_________
1 “How Big Data Can Improve Manufacturing” by Eric Auschitzky, Markus Hammer and Agesan Rajagopaul; July 13, 2014
Related Content
Loop Technology develops robotic arm for wing box inspection
Part of an R&D project with Spirit AeroSystems, the seven-axis Bravura robotic arm automates inspection and sealing within small spaces like aircraft wing boxes.
Read MorePhotothermal tomography system enhances composites NDT
JEC World 2024: Austria-based voidsy GmbH introduces the 3D V-ROX system, facilitating fast, contactless and nondestructive inspection with added efficiency and safety.
Read MoreRobotic NDT inspection solutions, services enhance multitasking capabilities
CAMX 2024: Matec Instrument Companies Inc. presents its range of nondestructive ultrasonic testing technologies, including robotic inspection systems for increased efficiency and reduced physical strain.
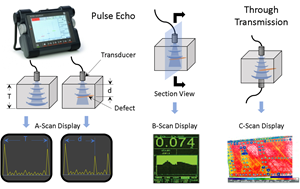
Read MoreNondestructive inspection methods available to composites manufacturers
An overview of composite laminate inspection techniques ranging from manual testing methods to more advanced, noncontact options.
Read MoreRead Next
VIDEO: High-volume processing for fiberglass components
Cannon Ergos, a company specializing in high-ton presses and equipment for composites fabrication and plastics processing, displayed automotive and industrial components at CAMX 2024.
Read More“Structured air” TPS safeguards composite structures
Powered by an 85% air/15% pure polyimide aerogel, Blueshift’s novel material system protects structures during transient thermal events from -200°C to beyond 2400°C for rockets, battery boxes and more.
Read MorePlant tour: Daher Shap’in TechCenter and composites production plant, Saint-Aignan-de-Grandlieu, France
Co-located R&D and production advance OOA thermosets, thermoplastics, welding, recycling and digital technologies for faster processing and certification of lighter, more sustainable composites.
Read More


