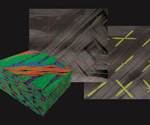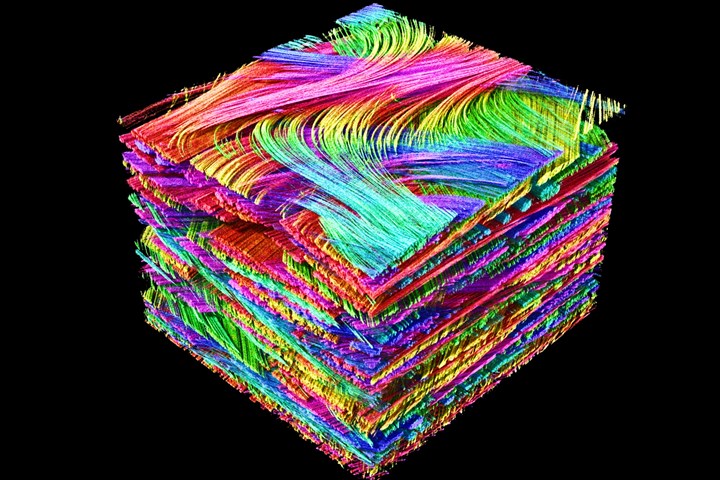
Fig. 1: Orientation analysis carried out on a glass fiber-reinforced sheet molding compound (SMC). Each direction is coded by a certain color. This orientation data can be used to obtain fiber orientation distributions over the thickness to validate flow simulations and to provide reliable data for structural simulation. Photo Credit: IAM-WK/KIT (Institute for Applied Materials/ Karlsruhe Institute of Technology)
As advances in composite manufacturing quickly widen the range of possibilities of part geometry, materials and structural strategies, new approaches to metrology and microstructure investigation must also be implemented to ensure continuous product improvement and reliability. Aerospace and other industries that employ composites have long relied on visual, acoustic, ultrasonic and, more recently, radiographic-based inspection methods, along with CMM (coordinate measuring machine) for surface-dimension checks. Each of these non-destructive tests (NDT) plays various roles based on time, cost, product complexity and degree of safety needed.
Because many composite products — be they consumer, sport, automotive or aerospace — push the limits of lightweighting and performance, deep interior part inspection grows more important for end-use safety, risk avoidance and business sustainability.
The role of computed tomography
Computed tomography (CT) scanning and related data analysis and visualization are ideal for today’s sophisticated products. In recent years, there have been step-change advances in X-ray tomography, high-performance computing, software algorithms and user-interfaces that communicate complex data from which CT scanning and data analysis have benefited. CT technology is unique in that it can penetrate most metals and the complex layers of composites in 360-degree views. That raw data is then processed by state-of-the-art software to create dimensionally accurate 3D-volume images comprising millions of voxels (individual 3D element, analogous to 2D pixel).
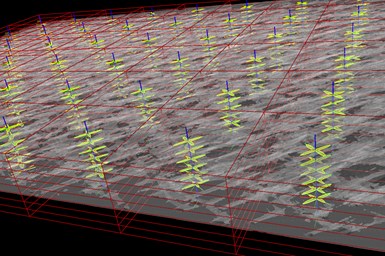
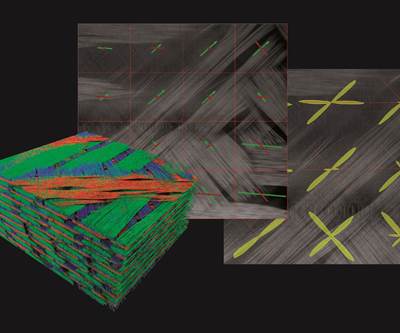
Fig. 2: Local orientation histograms of a woven fabric are shown in yellow. Using the principal orientations of these histograms allows engineers to measure the local shear angle of the material after the draping process. Photo Credit: Volume Graphics
Both the numerical outputs and the color-coded, 3D images created by such software provide startling detail of the microstructure of composites, allowing for as-designed and as-manufactured comparisons. An array of specialized digital tools is available to analyze material density, orientation of reinforcement structures, internal defects originating from design and manufacturing flaws or overload, and strain patterns calculated from multiple scans of different states of a sample using digital volume correlation.
The comprehensive capabilities of today’s CT-scan-data analysis for commercial and experimental types of composite structures are extensive. Any structure can be captured and characterized against its design intent. Templates can be created to rapidly and repeatedly analyze part features and problems automatically. This includes porosity analysis (e.g., the pore volume and distance from the surface); fiber and resin analysis for local fiber, fabric and roving orientations; and derived statistics like orientation histograms or orientation tensors (Fig. 2), fiber volume fractions, porosity within the resin and more. All the data may be exported into FEA tools and used for improving material modeling and structural simulations, enabling the building of comparative models for R&D purposes and component design. In appropriate cases, these analyses are even applicable for inline inspection (ILI).
Classic composite materials and analyses
The most common commercial composites fall into the polymer matrix compound (PMC) category that includes advanced carbon- and glass fiber-reinforced plastics (CFRP and GFRP). Ceramic matrix composites (CMC), made with long, multi-strand ceramic fibers, are also gaining recognition in high-heat applications, showing significant advantages over “technical ceramics” for crack resistance, thermal behavior and fracture toughness.

Fig. 3: Porosity (upper left and top) and fiber orientation (upper right) can be visualized and quantified using a single CT-scan. Both results can be mapped onto a FE-Mesh (bottom-center) to be used locally as inputs for the material modeling for structural analyses, or to validate process simulations. Photo Credit: Volume Graphics
These composite groupings, even CMC, can all benefit from the same CT-scan analysis technology for determining defect, performance and quality-specification states. It is only a matter of having scanning machines of the appropriate size and selecting a suitable scan strategy and analysis settings. Depending on the material at hand, there are inspection solutions for each fiber architecture (short, long and continuous), layup pattern (uni-directional or with specified angle per ply) and bonding material (resins, fabrics, silicon, etc.). Moreover, the analysis itself can be captured and automated (Fig. 1).
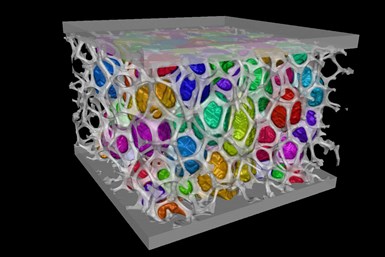
Figure 4: Sandwich structure with aluminum face sheets and a core made of open aluminum foam. Each individual cell can be separated automatically to generate a cell size distribution or evaluate the orientation of elongated cells. Photo Credit: Volume Graphics
Foams are another material used in composites that can be scanned and inspected with CT-data analysis and visualization software (Fig 4) to better understand their behavior. Although already in widespread use, many foaming processes are not well understood. Foams are, of course, lighter than their solid versions and can be used wherever there are no high stresses to carry. Good examples are physically or chemically foamed plastic in an injection molding process. But foams are also used as a core material in composite sandwich structures. Combined with face sheets made of the same dense material or another material that is much stiffer than the core, it is possible to create composite sandwich structures with high bending stiffness at low weight. Therefore, the pore size, the material volume fraction and the elongation of the pores are crucial in understanding the mechanical and thermal behavior of the material. A typical application for these materials is using foam to insulate the housing of refrigerated trucks.
Next month, in Part 2, I will explore imaging solutions for novel and hybrid composite materials.
About the Author
Pascal Pinter
(Dr.-Ing.) Pascal Pinter is the product manager for Material Research and Development at Volume Graphics GmbH in Heidelberg, Germany. He holds a Ph.D. in material science from the Karlsruhe Institute of Technology. At the institute for Applied Materials he was employed as deputy head of the hybrid and lightweight materials section and worked on the development of CT evaluation methods. He has a Master of Science in mechanical engineering with a focus on design and robotics and a Bachelor of Science in mechanical engineering with a focus on material science. He has also completed an apprenticeship as a tool mechanic for molding tools.
Related Content
Microwave heating for more sustainable carbon fiber
Skeptics say it won’t work — Osaka-based Microwave Chemical Co. says it already has — and continues to advance its simulation-based technology to slash energy use and emissions in manufacturing.
Read MoreCirculinQ: Glass fiber, recycled plastic turn paving into climate solutions
Durable, modular paving system from recycled composite filters, collects, infiltrates stormwater to reduce flooding and recharge local aquifers.
Read MoreNatural fiber composites: Growing to fit sustainability needs
Led by global and industry-wide sustainability goals, commercial interest in flax and hemp fiber-reinforced composites grows into higher-performance, higher-volume applications.
Read MorePlant tour: Daher Shap’in TechCenter and composites production plant, Saint-Aignan-de-Grandlieu, France
Co-located R&D and production advance OOA thermosets, thermoplastics, welding, recycling and digital technologies for faster processing and certification of lighter, more sustainable composites.
Read MoreRead Next
CT data drives new level of fiber analysis
Volume Graphics (VG, Charlotte, N.C., U.S.) has launched the latest version of its software solution for rendering data derived from computed tomography (CT) scanning operations.
Read MorePlant tour: Daher Shap’in TechCenter and composites production plant, Saint-Aignan-de-Grandlieu, France
Co-located R&D and production advance OOA thermosets, thermoplastics, welding, recycling and digital technologies for faster processing and certification of lighter, more sustainable composites.
Read MoreVIDEO: High-volume processing for fiberglass components
Cannon Ergos, a company specializing in high-ton presses and equipment for composites fabrication and plastics processing, displayed automotive and industrial components at CAMX 2024.
Read More

