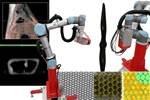
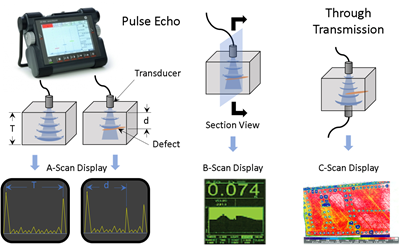
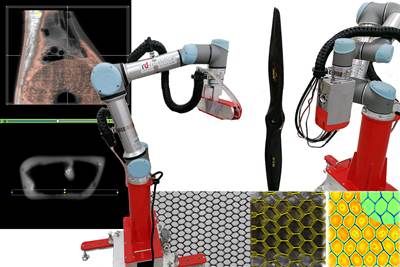
Due to their light weight and optimal mechanical properties, modern composite materials, such as carbon fiber-reinforced polymers (CFRP), are increasingly used in automotive, wind energy and especially aerospace applications. Nevertheless, the increasing use of composites in aircraft fuselages, translating sleeves or wing skins leads to challenges in required nondestructive testing (NDT) due to the heterogeneity and anisotropy of the materials. Ultrasonic inspection, for instance, is an often-used NDT method for composites, but can be slow and requires contact with the sample, most commonly with water. Alternatively, infrared (IR) testing methods such as flash thermography have been used for decades to achieve fast, large-area, noncontact scanning to detect defects and imperfections1.
Thermal tomography is a novel NDT method based on a diffusive process in which heat propagated through a solid is dampened as a function of location and is shifted in time. In other words, the specimen is thermally excited by absorbing radiation (e.g., a halogen lamp) or other forms of energy, which leads to a time-dependent temperature change. This is detected by measuring the thermal radiation from the specimen using a noncontact infrared detector such as a focal plane array IR camera. This process corresponds to the physics of transient heat conduction or IR waves and is, up to this point, comparable to classical active thermography2, e.g., flash thermography. However, such standard IR methods provide only surface-level or 2D results — determining the defect depth is impossible. In contrast, the analysis of the measured temperature field on the component surface in thermal tomography enables the application of modern numerical methods based on the transient heat diffusion process — which, in turn, enables reliable detection and identification of defects. This also enables 3D defect representation which makes it easy to determine the absolute size and depth of defects.
Researchers at the University of Applied Sciences Upper Austria (Wels) have pursued further development of IR testing for many years. These research activities have led to an increase in technical performance and development of equipment that is more in line with user requirements. The resulting 3D V-ROX photothermal tomography system (Fig. 1), developed by voidsy gmbh (Wels), a spin-off of the University of Applied Sciences Upper Austria, offers a more accurate and efficient NDT method for composites.
System components
The 3D V-ROX system is physically based on the method of active thermography and consists of excitation units, a detector unit and a computing unit. Due to its low weight (<6 kilograms total weight and thus easily mounted onto small robot arms) and compact design, the system is easy to use for mobile applications (including battery operation) and can be easily automated. The 3D V-ROX system can use standard post-processing methods, but it also enables 3D defect reconstruction through proprietary post-processing. Furthermore, it is possible to present measurement results in standard ultrasonic test (UT) representations such as A-, B- and C-scans. This then provides a fast, noncontact alternative for many material systems and components.
Fig. 1 shows a typical measurement setup, where a sample is placed in front of the 3D V-ROX system. The measurement is acquired in reflection mode, which means that heat is introduced to the same surface on which the temperature signal is measured. In general, the alignment of the excitation unit with the vision unit is crucial to ensure a homogeneous energy input into the component and to obtain correct results. With standard thermography systems, this setup time is often longer than the time required for the actual inspection task.
One difference in the 3D V-ROX system, compared to standard thermography systems, is the fast and compact installation of the measurement setup. This is possible because the excitation units do not have to be aligned to the vision unit, because the positions of the single units are structurally fixed. The 3D-V-ROX system is also equipped with a distance measuring system and a cross laser which support inspection personnel in carrying out inspection tasks and enable reproducible evaluation results.
Figure 2. Example workflow diagram of the 3D V-ROX as developed by voidsy gmbh, a spin-off from the University of Applied Sciences Upper Austria.
The inspection procedure using the 3D V-ROX system is shown in Fig. 2. Here, the inspected surface is thermally stimulated with a maximum power of two 2-kilowatt halogen lamps while the surface temperature signal is acquired simultaneously. As the introduced heat propagates through the sample, if it interacts with a defect — such as a disbond or foreign object debris (FOD) — the propagation is disturbed and the surface temperature signal changes locally. Usually, these changes are hardly recognizable in the surface temperature signal. Therefore, the 3D V-ROX system transforms the measured signal — which is a function of position and time — into the corresponding mirror source distribution. The evaluation of each detector-pixel in the mirror source distribution provides an A-scan. For a defect-free sample and measurement carried out in reflection mode, the A-scan shows a front wall and a back wall echo similar to UT. However, if defects are present, the A-scan also shows intermediate echoes.
The 3D V-ROX system performs the complete evaluation procedure. During this computation, the temperature signal and the mirror source signal can be transmitted to a desktop computer, where the gathered data can be visualized in A-, B- and C-scans using the developed void viewer application.
Use case: CFRP aircraft spoiler
Figure 3. 3D V-ROX results in A-, B- and C-scan representations of thermal measurement data (i.e., photothermal tomography).
The screenshot in Fig. 3 shows the mirror source distribution based on the temperature signal obtained using the measurement setup in Fig. 1 as performed on an aircraft spoiler. This part features a sandwich construction comprising monolithic CFRP skins bonded to a Nomex honeycomb core. The specimen contains FOD from different materials (metal, Teflon, prepreg foil) at varying depths.
The XY plane (top right) shows a cross-section of the mirror source distribution parallel to the test surface, i.e., a C-scan. The sliders on the user interface can be used to control the cross-sectional position of the C-scan and visualize defects at different depths. The XZ (top left) and the YZ (bottom right) planes show cross-sections perpendicular to the C-scan, i.e., B-scans. In these views, the front wall, back wall echoes and back wall displacements are all visible due to FOD. Using the back wall position, the inspection personnel can, for example, assess the interface between the skin and core and check whether the bond is sufficient. In contrast to standard thermography evaluations, the back wall position also provides information about the thickness of the skin. If the determined thickness does not match the nominal thickness, material inhomogeneities of the skin (e.g., FODs) can be identified.
Until now, standard thermography has often been used as a qualitative method, providing a quick, noncontact overview of the integrity of a component. In the event of any thermal anomalies, a second test method, in most cases ultrasonic, had to be used to determine absolute defect sizes. Photothermal tomography with the compact 3D V-ROX enables 3D defect visualization and easy automation of inspection tasks. It significantly increases the efficiency of determining the lateral defect size and depth of defects, so there is no need to use a second inspection method, saving time and cost in composite structures inspection.
References
1Maldague XPV, Moore PO (eds) (2001). “Infrared and thermal testing,” 3. ed. Nondestructive testing handbook/Robert C. McMaster, ed. American Society for Nondestructive Testing; American Society for Metals ; Vol. 3. American Society for Nondestructive Testing (Columbus, Ohio)
2Balageas D, Maldague X, Burleigh D et al. (2016). “Thermal (IR) and Other NDT Techniques for Improved Material Inspection.” J Nondestruct Eval 35. https://doi.org/10.1007/s10921-015-0331-7
About the Author
Dr. Holger Plasser
Dr. Holger Plasser, the CEO of voidsy gmbh (Wels, Austria), drives innovation while maintaining high standards of quality in NDT using his background in mechatronics and economics. He holds a Ph.D. from the Institute of Polymer Processing (IPPE) at Johannes Kepler University (JKU, Linz, Austria) and a Level III certificate from the Austrian Society for Non-Destructive Testing (ÖGfZP) where he is also an active member of the Thermography Subcommittee, contributing to advancing thermographic analysis techniques.
Dr. Gregor Thummerer
Dr. Gregor Thummerer is co-founder of voidsy gmbh and has extensive practical and theoretical experience in mechanical engineering. He received his Ph.D. at the Vienna University of Technology (TU Wien) at the Institute of Material Science and Technology, where his research focused on 3D defect reconstruction and visualization as well as parameter estimation based on active thermography data. He is responsible for the development of evaluation algorithms, defect visualization and hardware design at voidsy.
Related Content
Testing to support composite bolted joint analysis
An overview of ASTM Standard Guide D8509, and its coupon-level mechanical testing of design properties for analyzing composite bolted joints.
Read MoreMulti-scale 3D CT imaging enables digital twinning, high-fidelity simulation of composite structures
Computed tomography (CT) provides highly accurate 3D analysis of internal microstructure, performance simulation of carbon fiber/PEEK satellite strut.
Read MoreDamage tolerance testing of sandwich composites: The sandwich CAI test
A new ASTM-standardized test method established in 2022 assesses the compression-loaded damage tolerance of sandwich composites.
Read MoreCrashworthiness testing of composites: A building block approach, Part 1
Determining the crashworthiness of composite structures requires several levels of testing and analysis, starting with coupon-level crush testing.
Read MoreRead Next
Multi-scale 3D CT imaging enables digital twinning, high-fidelity simulation of composite structures
Computed tomography (CT) provides highly accurate 3D analysis of internal microstructure, performance simulation of carbon fiber/PEEK satellite strut.
Read MoreNondestructive inspection methods available to composites manufacturers
An overview of composite laminate inspection techniques ranging from manual testing methods to more advanced, noncontact options.
Read MoreRobotic computed tomography – removing NDT barriers for composites
Radalytica uses collaborative robots, ultra-sensitive X-ray photon detectors and the ability to combine CT with ultrasound, surface profiling and other inspection methods to optimize composites part quality, production and reduce cost.
Read More


